Make quick charts and maps 📈
Datawrapper is easy, free and fast 💯
Welcome back to Wonder Tools! Last week I highlighted the best resources for listening to podcasts and spotlighted a few extraordinary episodes. Other recent posts highlighted a neat app (Listy) for making lists and for organizing your personal contacts (Clay). This week’s post focuses on a simple, free way to make pretty graphics without any prior design or data experience.
Datawrapper makes it easy to create your own data visualizations. It’s free and easy to use for non-designers. If you just want to make a nice chart or map, try diving in with any data you have at hand. Below are 3 steps to creating a quick visualization.
If you’d like to go slow, here’s step-by-step help.
If you want some sample data to use, try Google’s Dataset Search, Kaggle, Data.gov, Data Hub, or one of these fun datasets.
Step 1. Figure out what you want to show
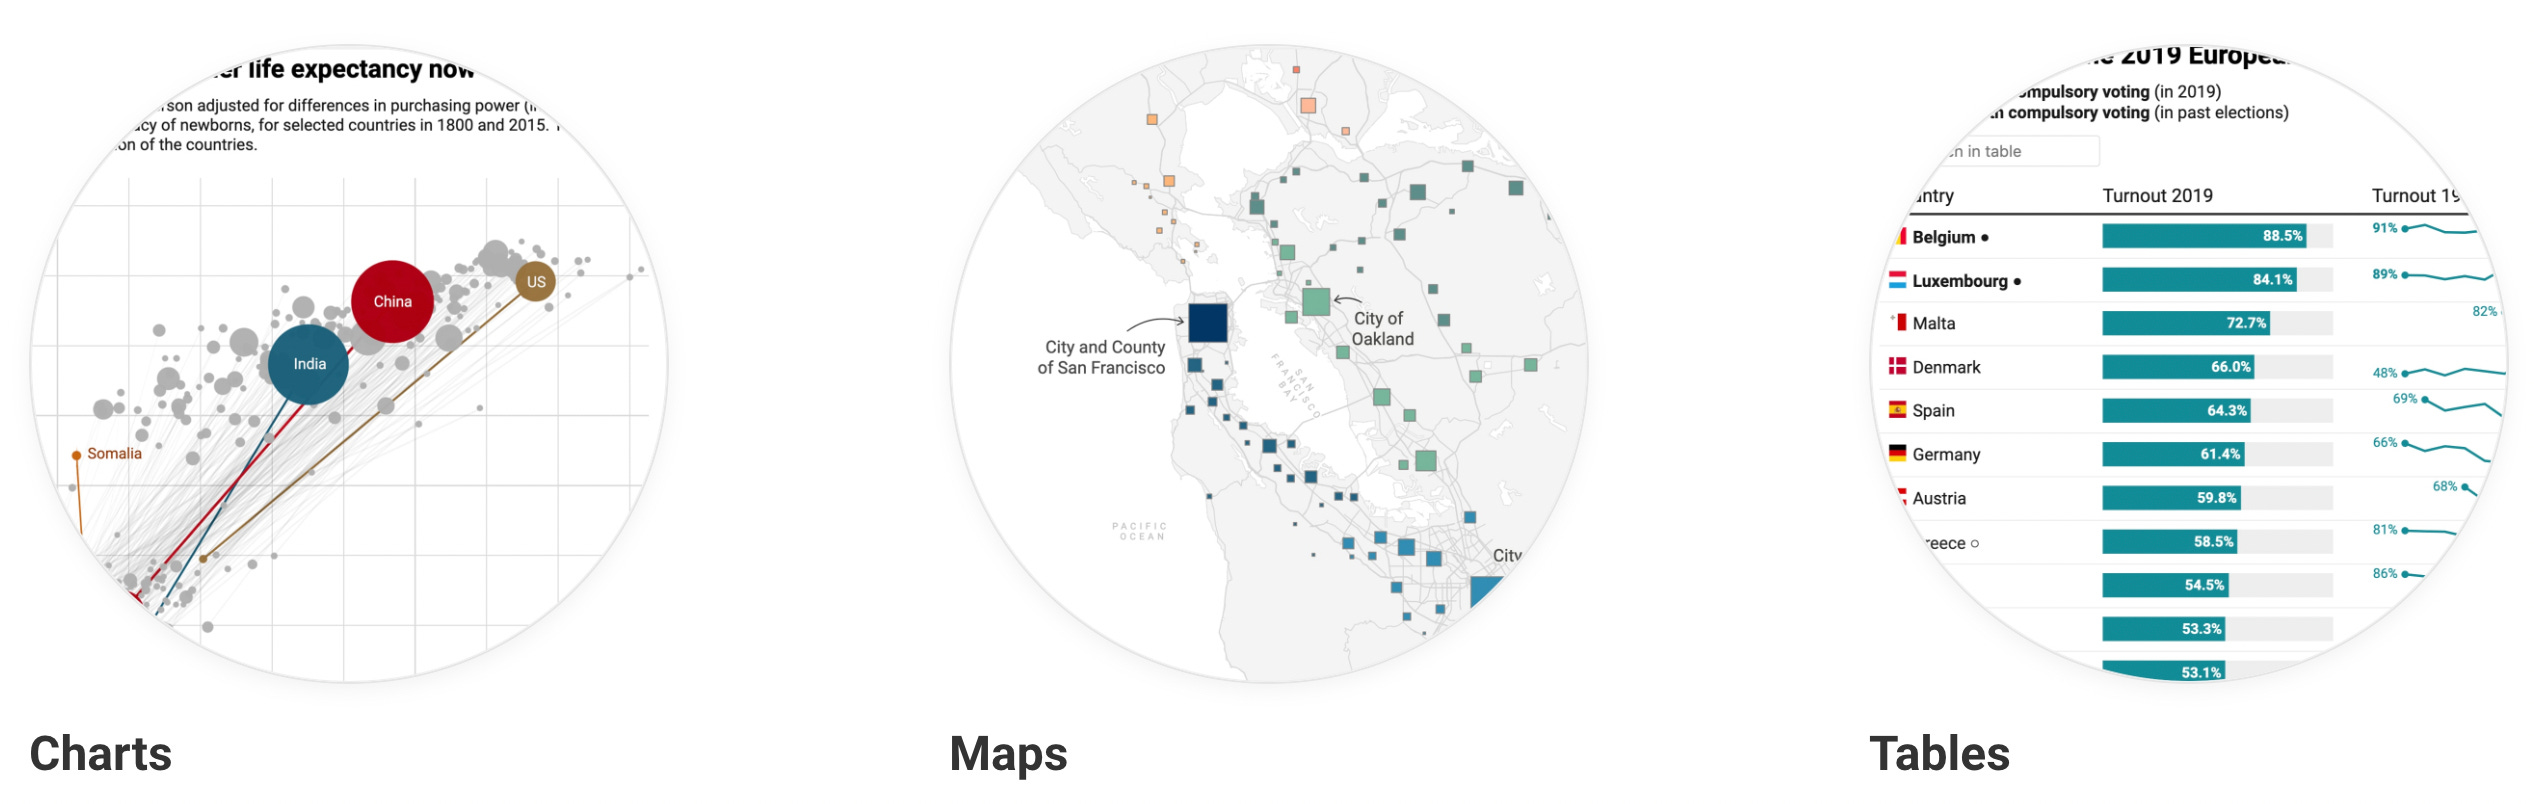
A list of places 🗺 This could be where customers, employees or applicants are from, a list of target markets, or a list of significant locations within a particular city, region or country.
A list of numbers 🔢 This could be sales totals, or a comparative number of subscribers, followers or downloads.
A table of information ⌗ in two or more columns. That’s handy if you want to emphasize individuals and their titles, products and their significance, or social platforms and their relevance for your audience. Datawrapper lets you make shareable, embeddable, visual tables.
Step 2. Bring your data into Datawrapper
Datawrapper lets you import info in several simple ways.
Paste it in. Just copy and paste it from a spreadsheet, an online source, or wherever else it already exists.
Import an Excel file or a csv file — the two most common formats for data.
Paste a link to an existing Google Spreadsheet. Make sure you set the spreadsheet to public first so Datawrapper can access it.
Link to a data file on find on the Web. If you see a data file online in csv format (comma separated values), you can link directly to it, without having to download it first.
Step 3. Choose a visual representation
Once you’ve brought in your data, decide how you want your chart, map or table to look. For charts you can choose from 20 visualization types including bar, area, line and pie charts. For maps, you can choose between three types.
Chloropleth maps let you color code a map based on how common something is in a particular place. This works for showing things like regional incidence of a disease, geographic breakdown of voting, or income by location. Or for business data like purchases or engagement, broken down by location.
Symbol maps are useful for showing hotspots. I used this map type to show application origins for a 2020 cohort of our Journalism Creators Program.
Locator maps let you drop pins on a map to spotlight particular locations. This works well to show a few specific spots impacted by something. Or your favorite local dessert spots. Or the places most impacted by a new policy.
Share this post with a friend or colleague or via social 🎁
How do you create data visualizations? Leave a comment👇
Subscribe to get future posts in your inbox ⬇
Great Alternative Tools for Data Visualization
Flourish is a terrific tool for making data visualizations. It has far more options than Datawrapper in terms of the kind of visuals you can create. It’s also a bit more complex, given the flexibility you have to design dozens of different data visualizations.
Mapbox Studio is excellent for creating professional-looking maps customized to look exactly the way you want, but it takes time to figure out the various menu options and to learn your way around it.
Google My Maps is simple for creating shareable maps showing places of interest. You just search for something then click “add to map.” You can annotate spots, or just use default info from Google Maps.
Additional Resources
Datawrapper Academy 100+ short pieces that explain how to use Datawrapper
Slides for a detailed Datawrapper workshop with lots of good examples
Matching Chart to Purpose — A 1-page visual guide by Dr. Andrew Abela
Picking the Right Chart Type by Jānis Gulbis
What to Avoid
27 visuals that didn’t quite work
Sponsored Message
Have You Seen The News?
Repetitive isn’t it?
Every day, every site is publishing the same stories about the same issues. And it’s all negative! 😒
Trying to stay informed isn’t just time-consuming, it’s anxiety-inducing. And people are tuning out because of that. 📉👎
Enter: The DONUT! 🍩🦸
They arrange the most discussed and influential topics each day into a tidy newsletter complete with charming wit and awesome memes.
The whole thing takes just a few minutes to read and is engaging, informative, and features exclusive discounts. 👌
Oh. And it’s 100% FREE. 🎉
Join 500,000 monthly readers and personalize your daily news diet in 10 seconds! 🍩😎
Amazing blog, thank you. I will picture it next week in mine http://competia.substack.com . Thank you again. Best, Estelle.